Elastic Cash - Tracking Finances in the Elastic Stack
I am not a financial advisor, this is not advice. This post is just for fun. For further advice, please seek a professional financial advisor. Don’t sue me.
Tracking your personal finances is a great thing to do when budgeting and saving so you can see exactly where your money is going. I found that when I don’t track my spending I make a lot of assumptions of where my money is spent and it is vastly different to where the money is actually going. I would recommend tracking spending to anyone who is looking to get their finances undercontrol and attempting to save more.
There are so many different ways to track personal expenses; some of the more common ones include excel spreadsheets and mobile applications. Some are better than others, it mainly comes down to preference. I decided to complicate it even further by using a logging system to help track my finances.
I’ll start by saying it’s almost definitely not worth setting up as you could get a very similar result by just using excel spreadsheets. I started this as a fun idea when I was playing around with the Elastic Stack and it seemed like it would work well. I really like using it to track finances but it is horrendously overkill and likely isn’t worth the effort. Anyways, here is Elastic Cash; a way to track finances in an Elastic Stack.
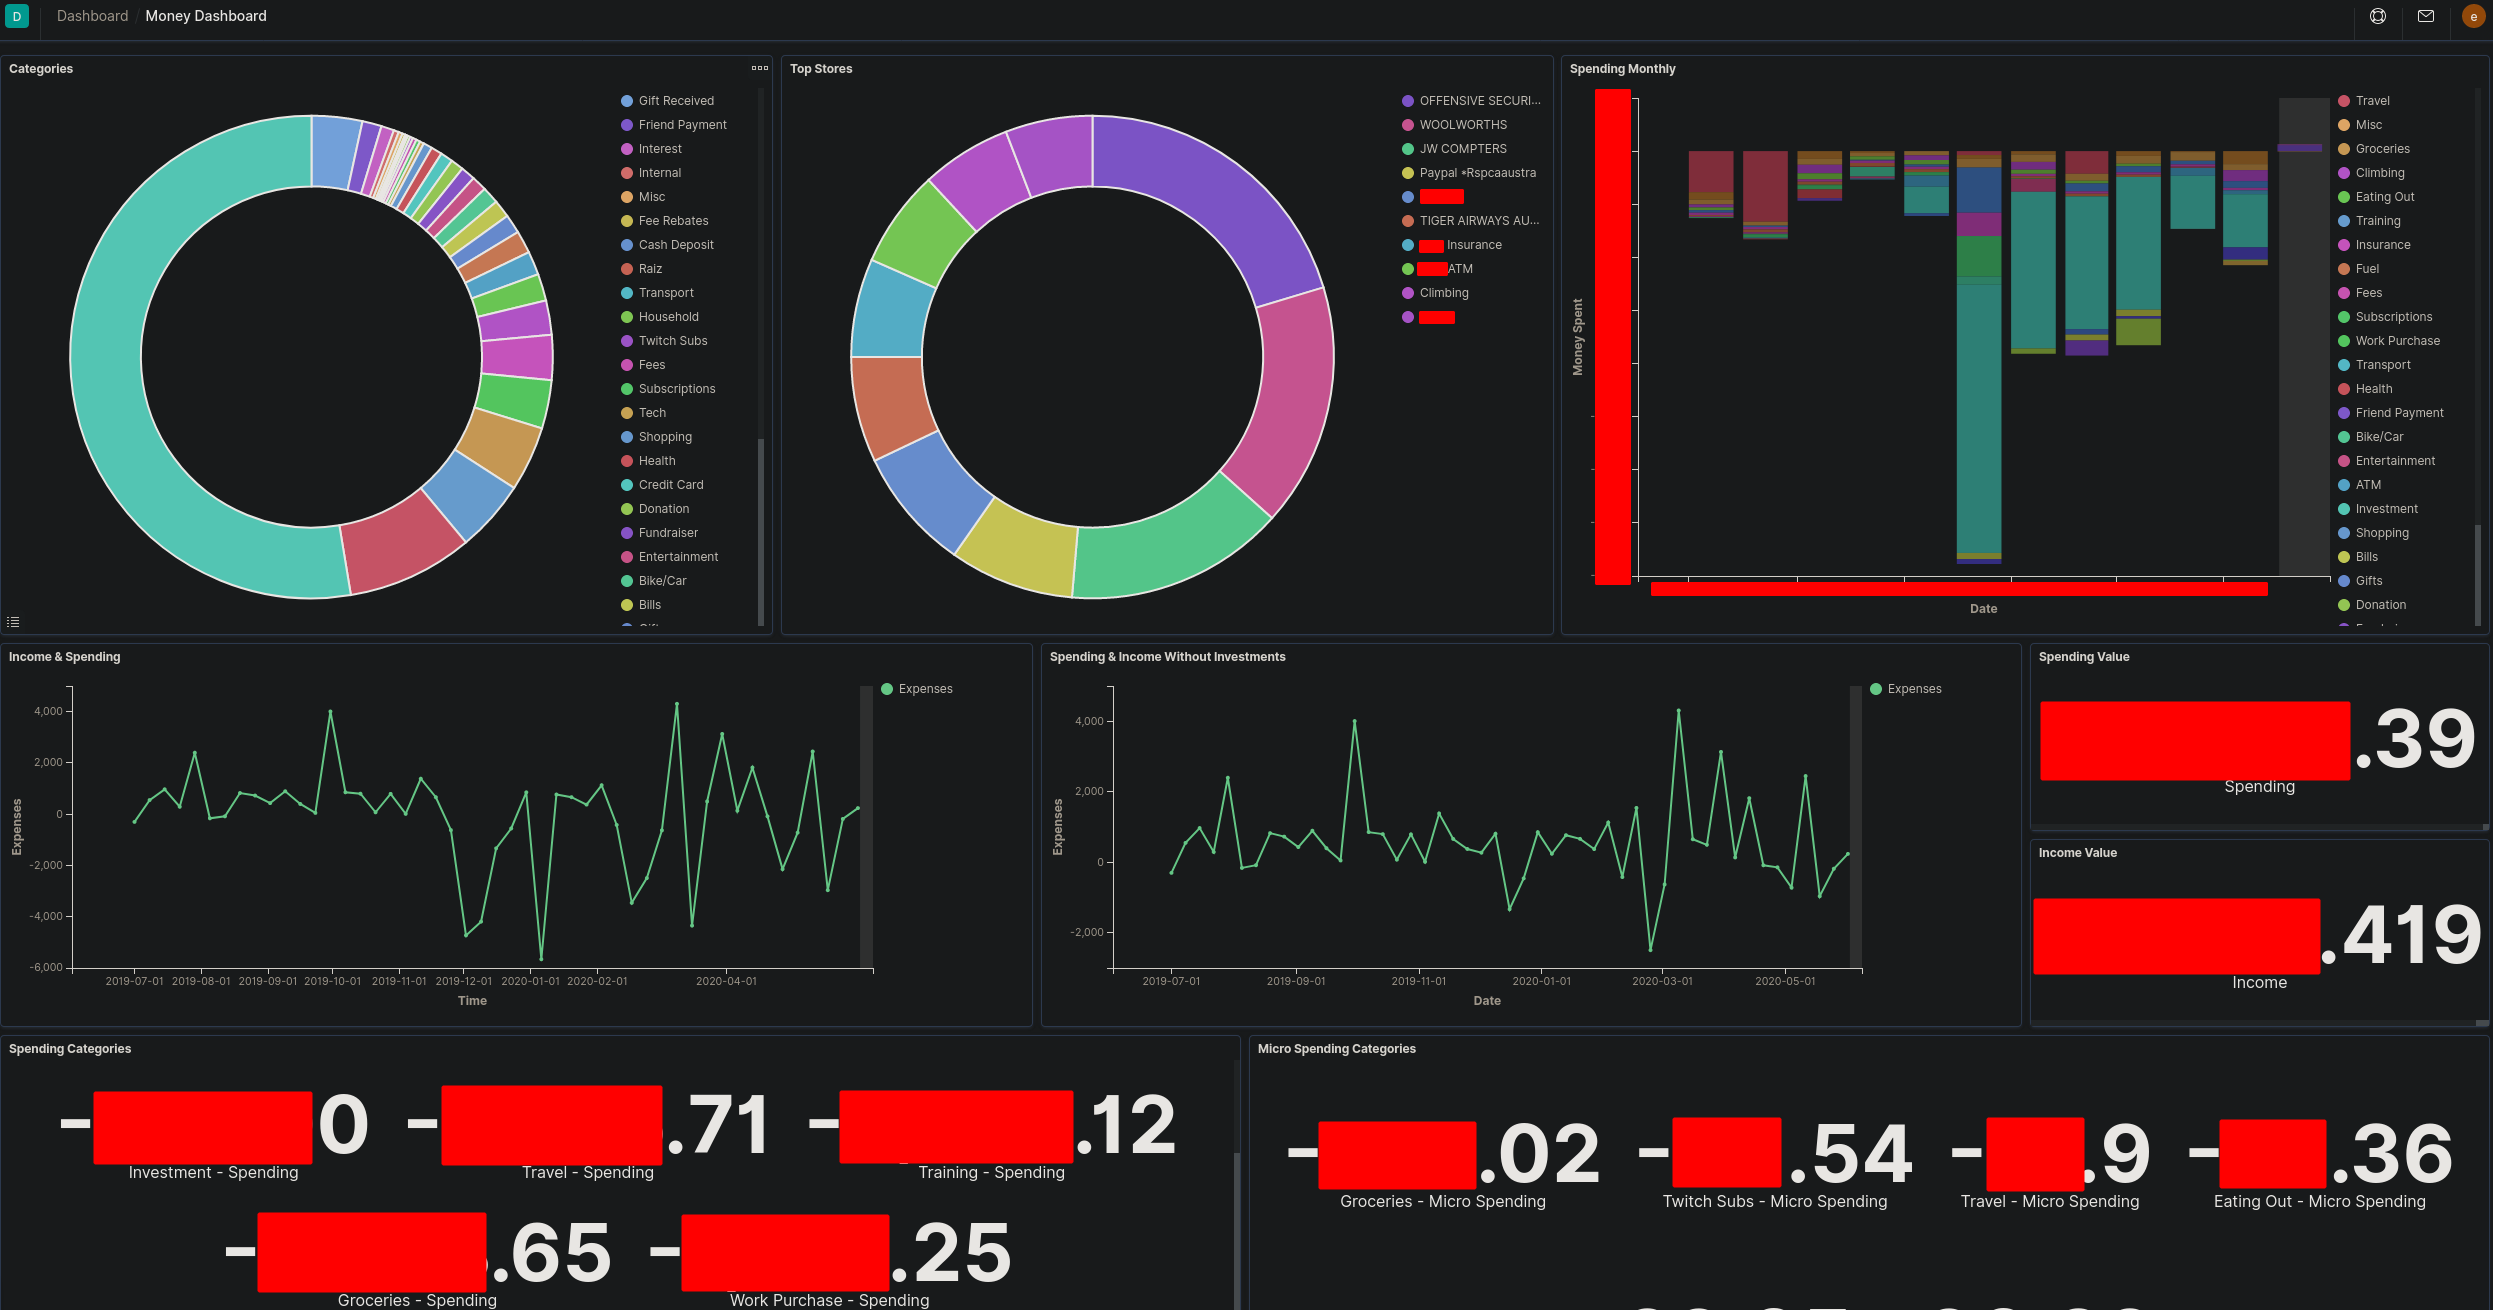
Once you get all the data cleaned and put into Elasticsearch you can really make some amazing visuals in Kibana to help view where your money is going. Here is the primary dashboard that displays all the visual graphs and information. Looking at this dashboard you get a real overview of most of the data, allowing you easily identify spending habits and where your money is flowing. Here is a breakdown of the following graphs:
Categories
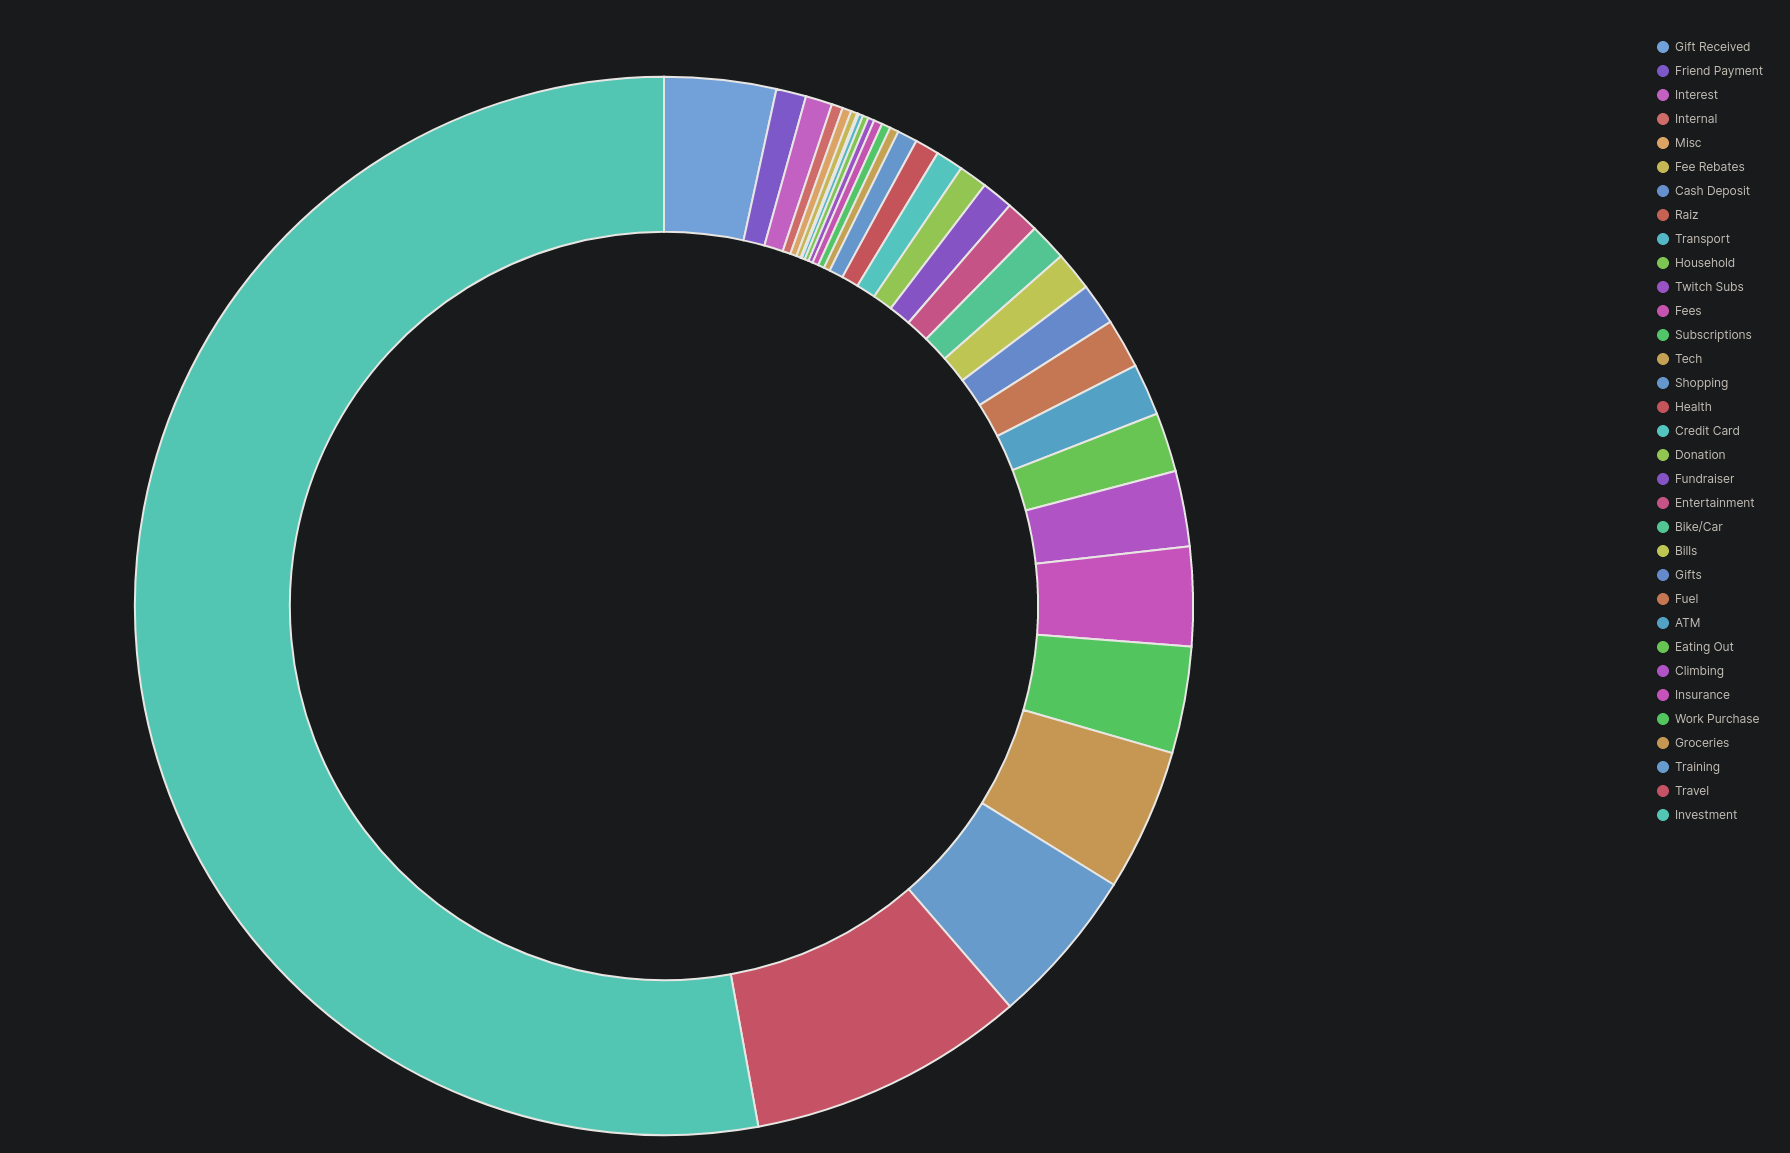
This is a simple graph of the categories of spending, these categories were applied to the data according to where they were spent. As an example, spending money at a supermarket is counted as “Groceries”. This is just a simple way to group the variety of places I spend money.
Top Stores
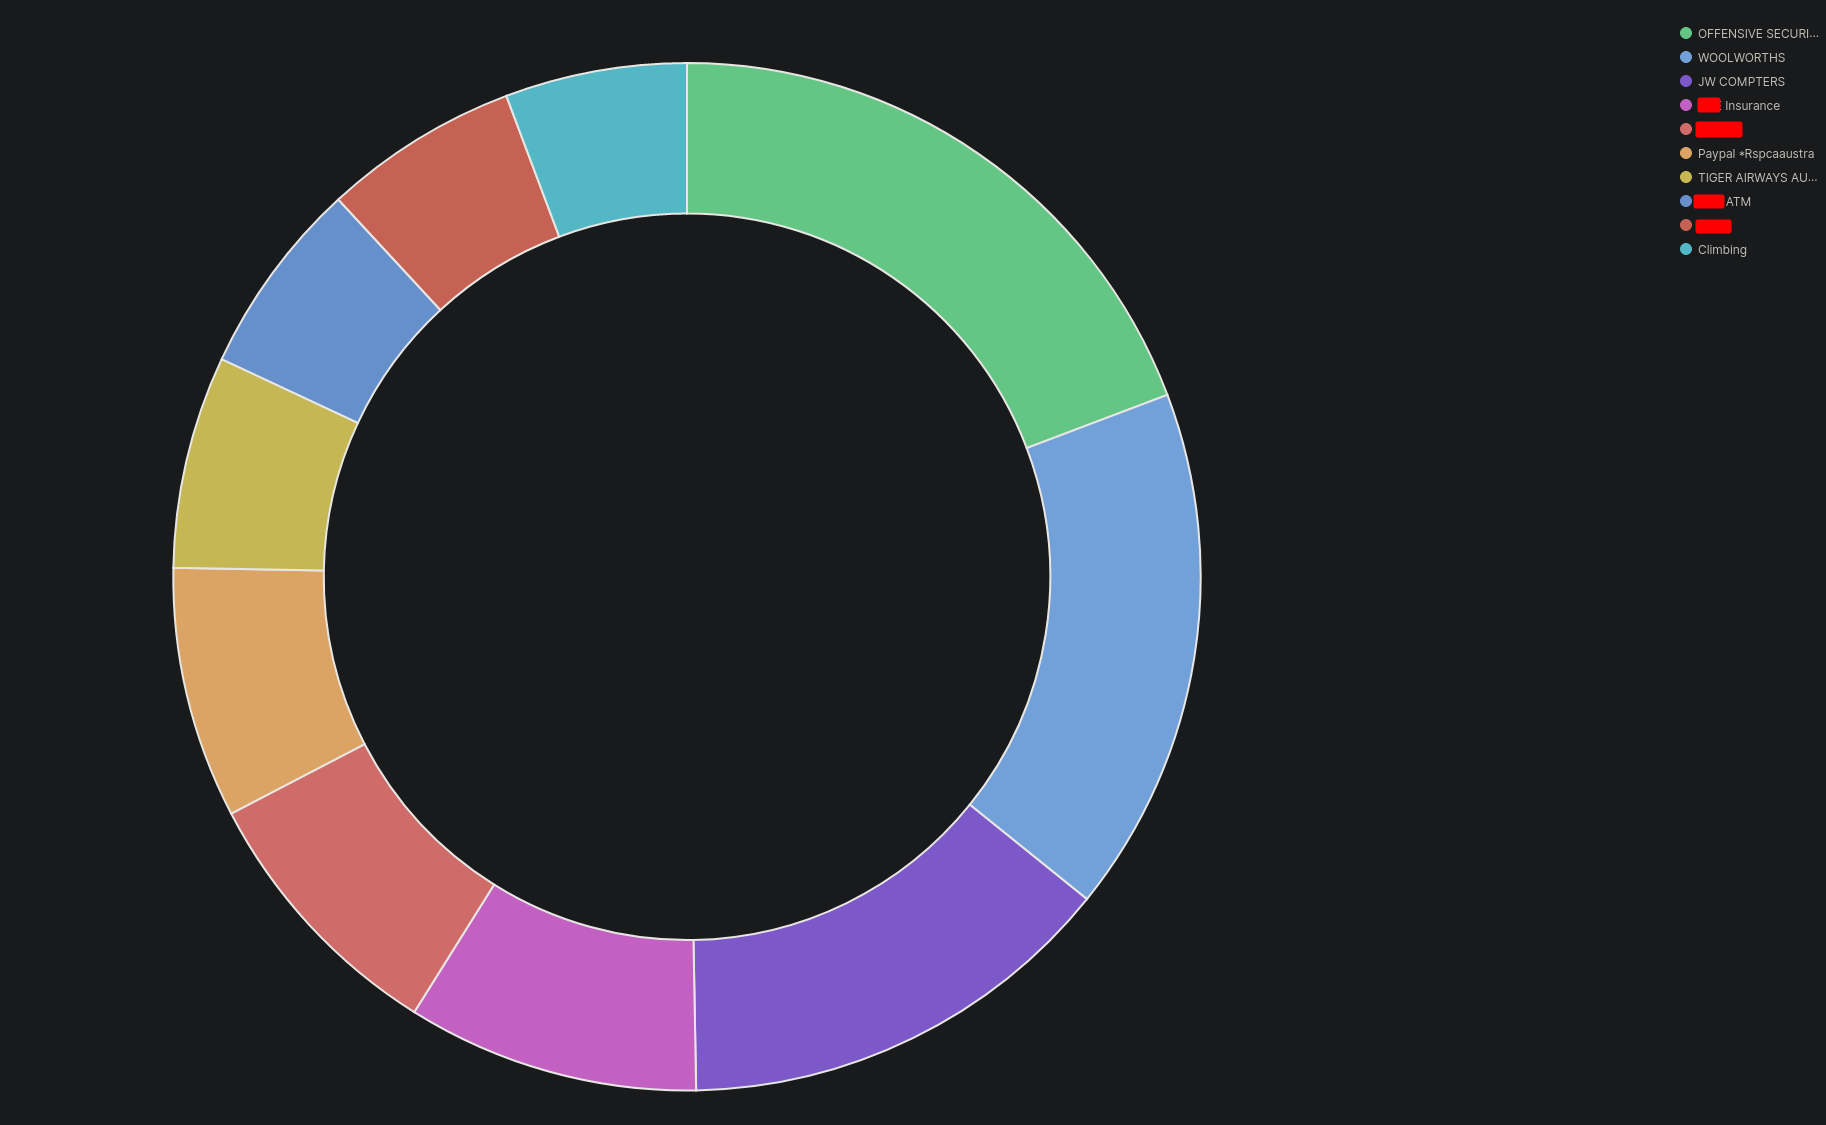
This is a graph displaying what stores/vendors I had spent the most money at throughout the timeframe set.
Spending Monthly
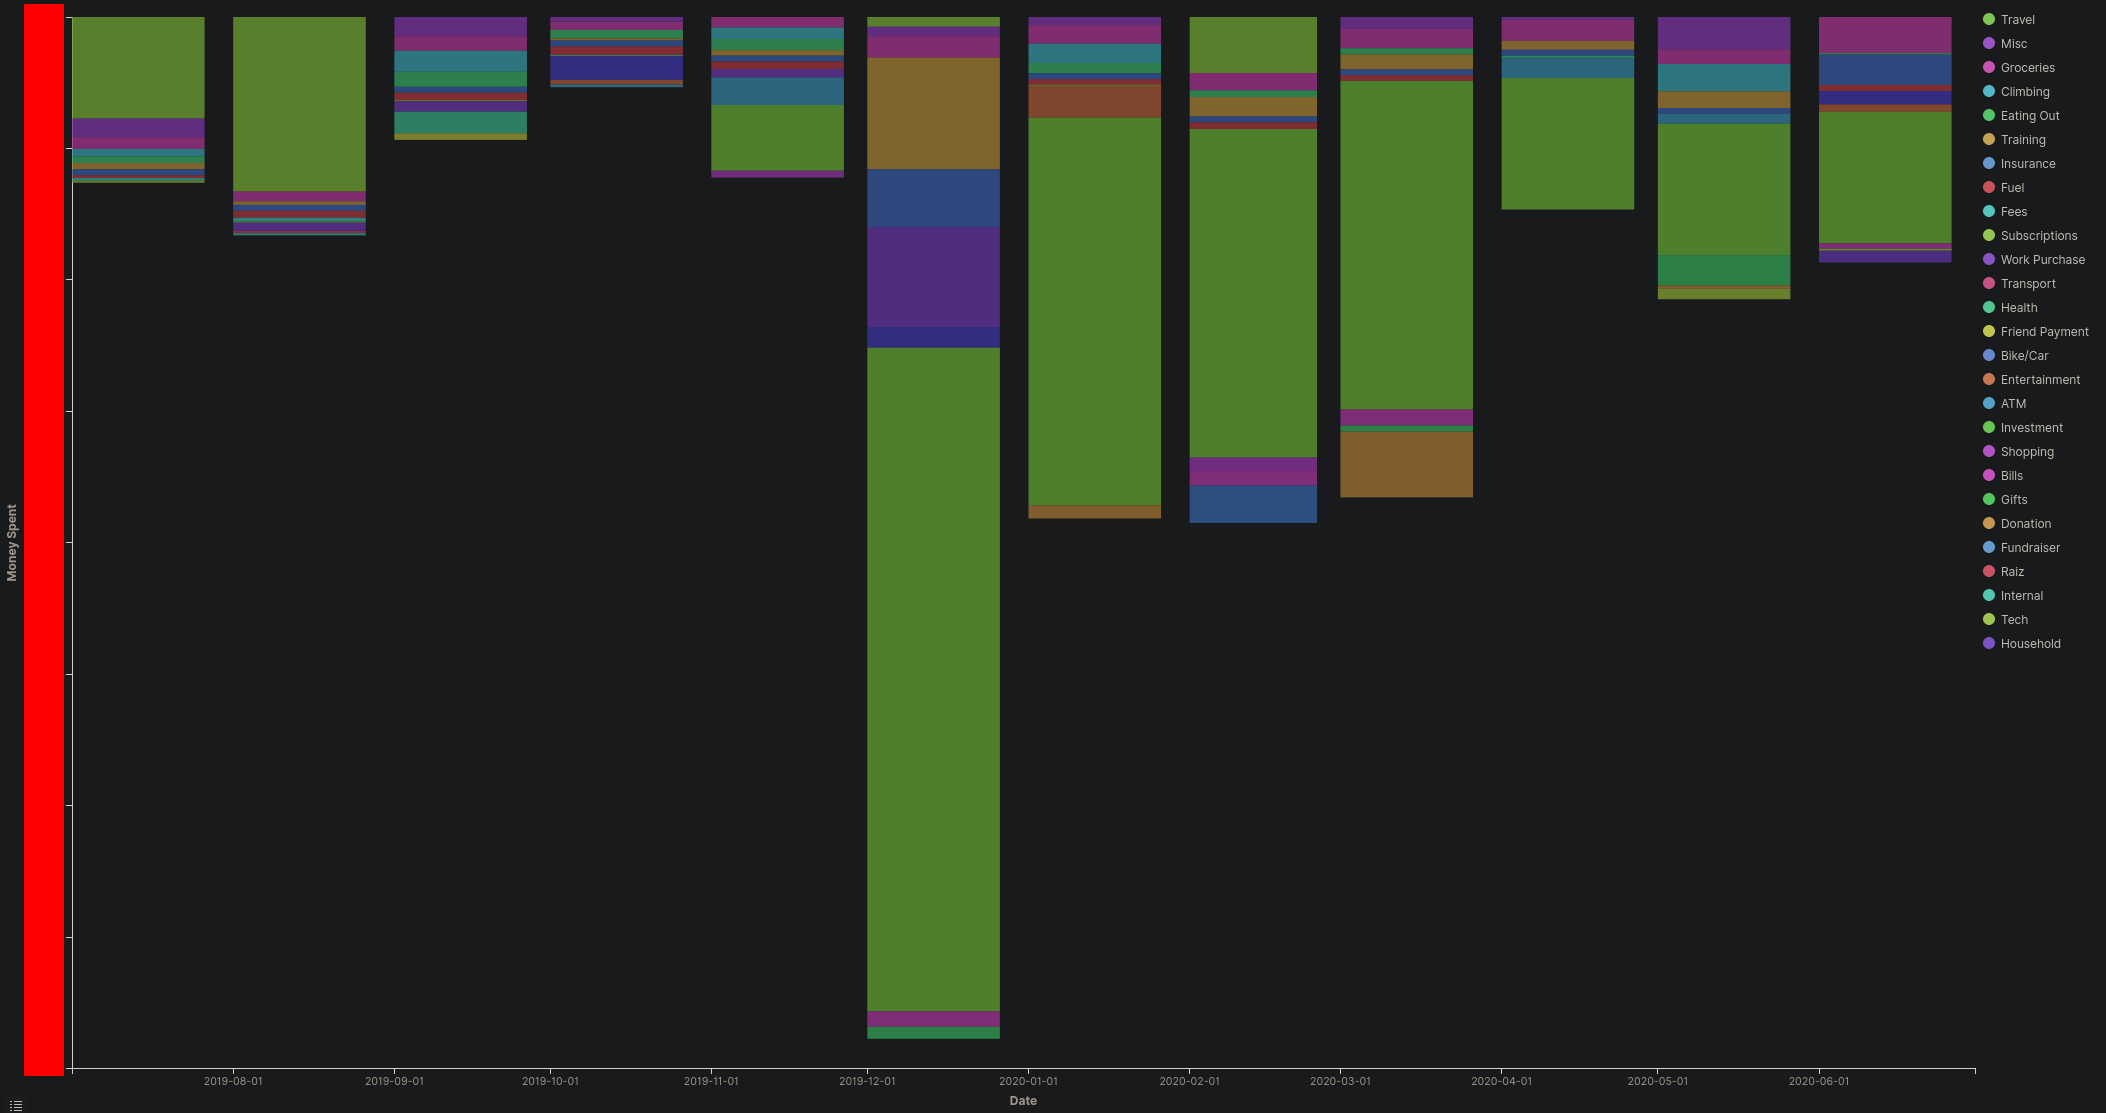
This is similar to the categories pie chart, but it has it split month by month so I can view what categories had higher amounts than normal, this allows me to pick out abnormalities. This is specifically set to Monthly, however can be easily broken down into different time frames like weeks.
Income vs Spending
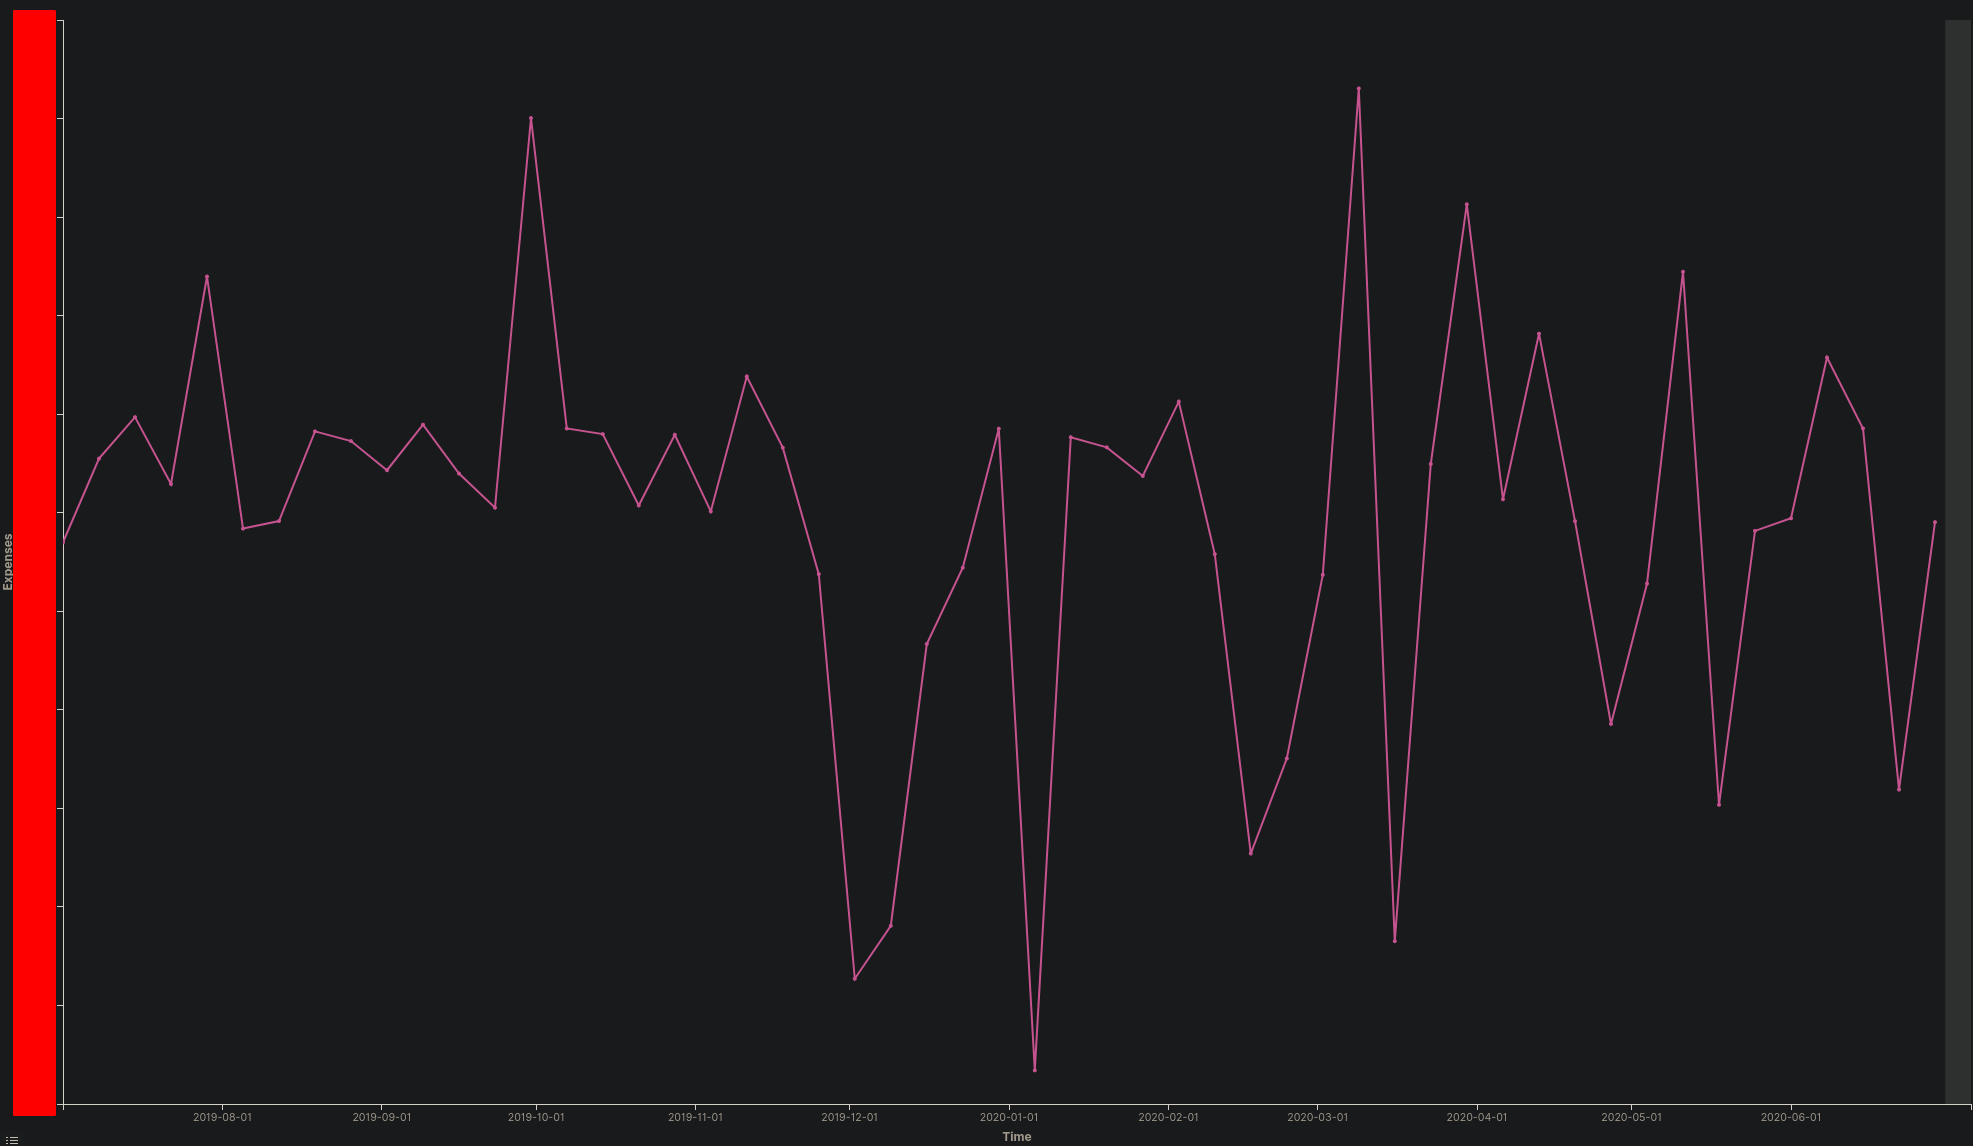
This is just a visualisation of income and spending, not super useful but interesting to display.
Income vs Spending without Investments
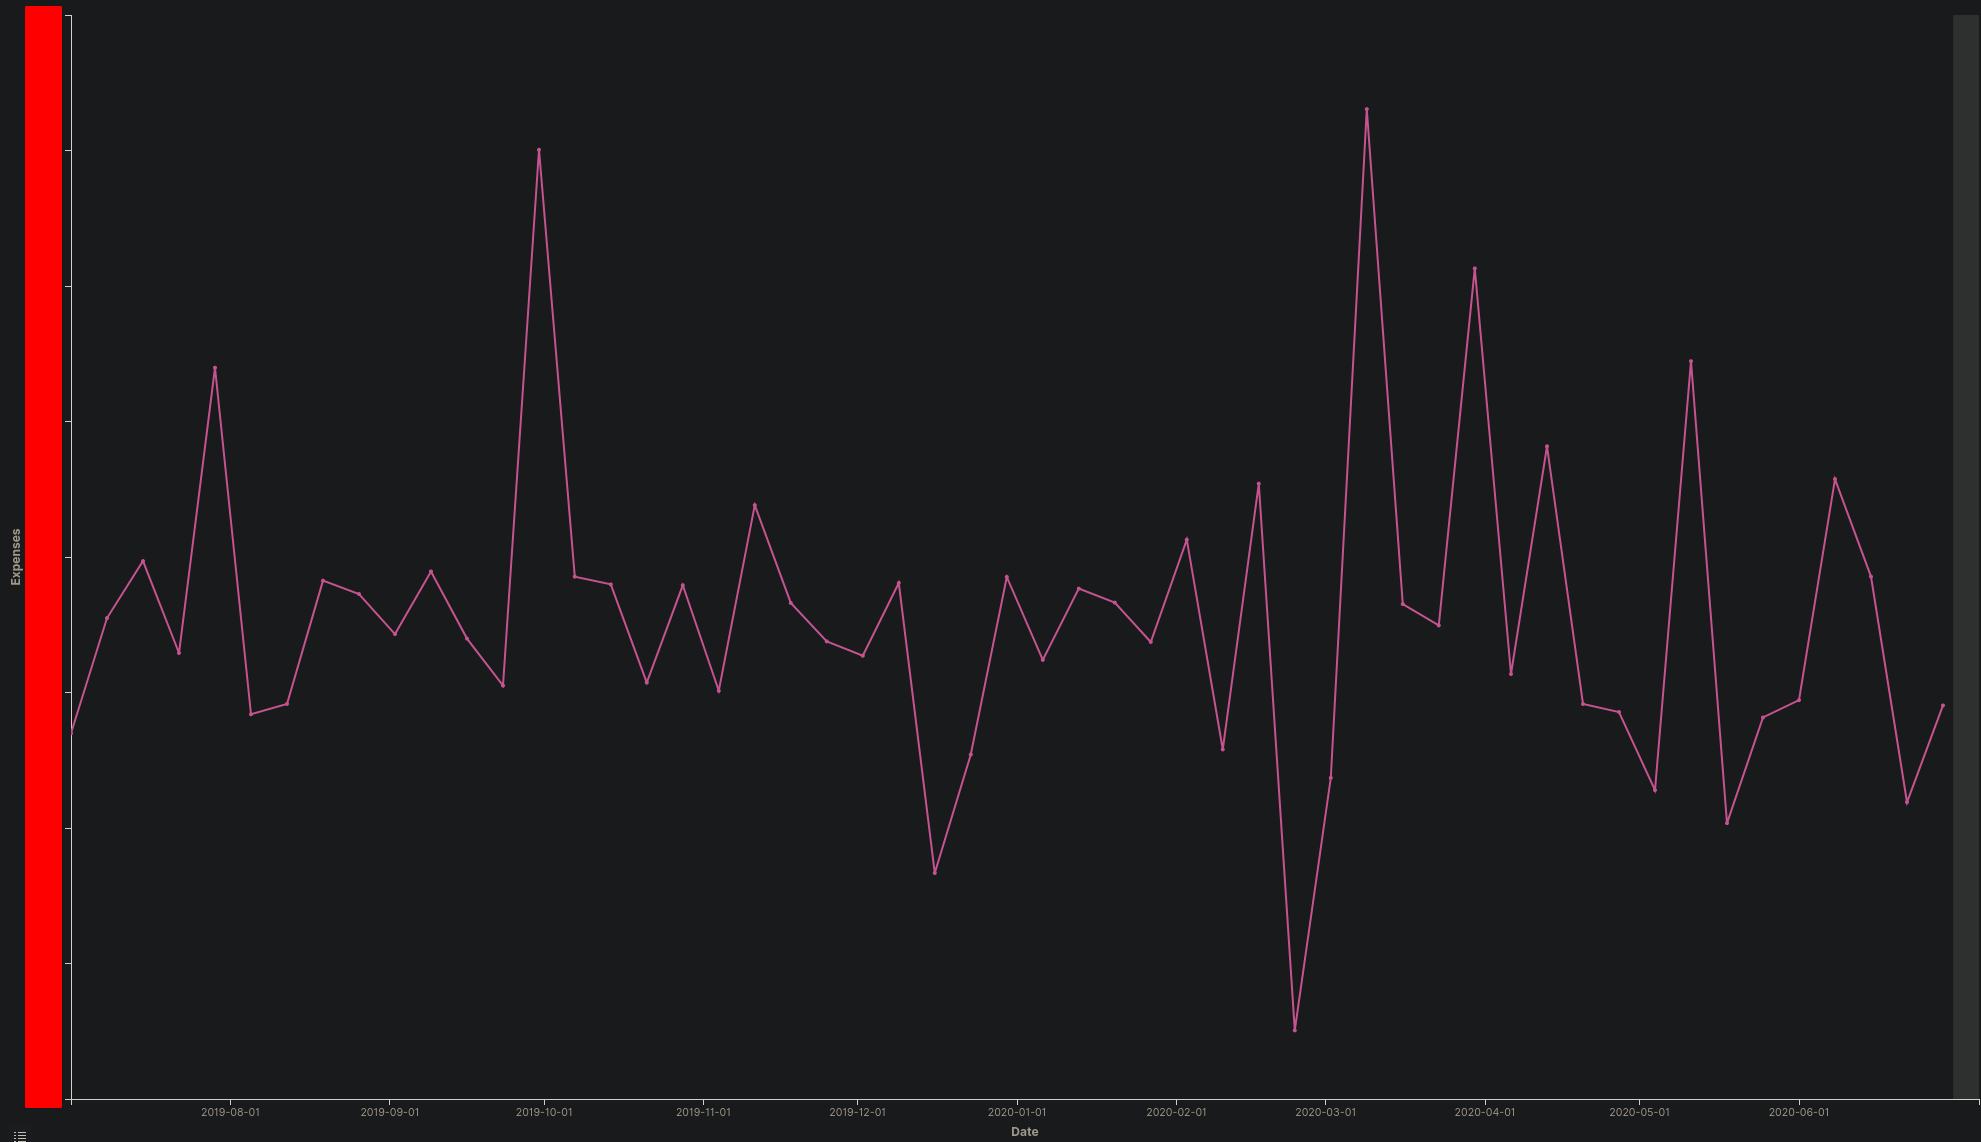
Very similar to the one above, however this is without investments accounted for which greatly skewed the graph.
Payback Expected vs Possible Payback
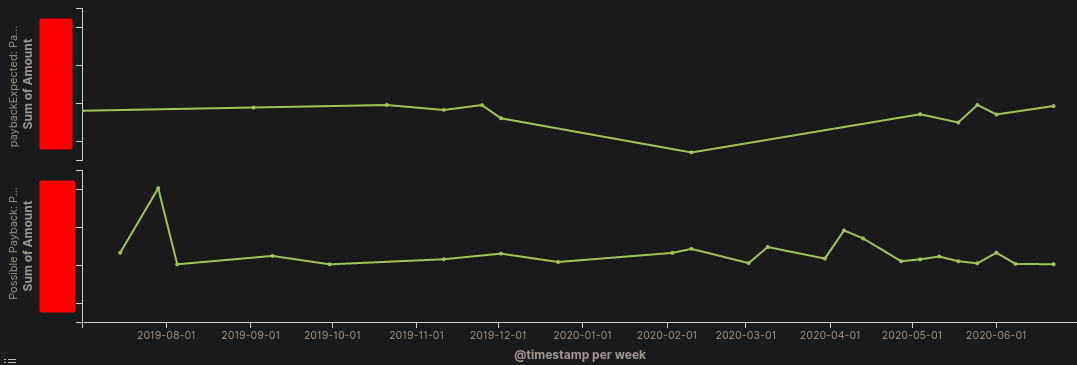
Many of my transactions involve me paying for things for others and receiving repayments from friends (like a group lunch where they don’t split bills). This has been one of the harder things for my to attempt to automate and account for. The idea is these two graphs should be pretty similar but it’s still something I’m refining.
Other Visuals
Along with all the graphs featured above, I’ve got a few other simple numbers and displays on the page, they’re pretty self explanatory, but they include:
- The dollar amount of money I’ve been paid
- The dollar amount of money I’ve spent
- Spending Categories - the dollar amount spend in each category
- Microspending Categories
Microspending Categories
This counts any purchase that is under $10, adds them all up and sorts them into categories so I can see the dollar amount of how much I’m microspending.
This display I felt the need to expand on as it in my opinion is one of the most common ways to spend lots of money without comprehending that you’re doing it. Microspendings are the small purchases that you buy on a regular basis that add up over time. Examples include:
- daily coffee before work
- eating out daily at work
- afternoon snacks from the vending machine
These all are very small purchases that are normally written off at the time as nothing, but add up quite drastically over time. Take the following example:
On your work you grab a $5 coffee from your local cafe. For morning tea you grab a $4 muffin from the work cafe. For lunch you go to the local burger place because they offer a deal for $15. After lunch you need a bit of a sugar rush so you grab a $3 chocolate bar from the vending machine. Individually these purchases appear to be minimal and won’t make a big impact in your overall savings, right?
Assuming this a daily ritual on work days you’re spending roughly $540 a month on micro spending.
More information on microspending HERE
Conclusion
Overall, the Elastic Cash project was a cool idea when I originally planned it out, in practice it probably isn’t the best way to track finances. I think it does work well to an extent, however it does have some downfalls. The Elastic Stack is a huge program that really doesn’t get fully utilised for this project, it is definitely overkill. Kibana is definitely the shining star for this project with its graphs and visuals, however the rest of stack isn’t exactly needed for it to work. Importing data into the stack is quite painful compared to just importing into an excel spreadsheet.
One of the better things that came out of it was a way to automatically sort and manipulate data using ruby scripts. I was able to piece together a script that can sort many exported bank csvs into clean data which I can still use if i go back to using an excel spreadsheet.