Elastic Stack - How you can use it to assist your Incident Response
The Elastic Stack (formerly the ELK Stack) is composed of 4 core open source tools that create the stack, these tools combined allow for data to be taken from any source securely and used to search, analyse and visualise in real time. The core components consist of:
- Elasticsearch is a distributed database that is easily searchable
- Logstash is a data ingestor that is used to filter and customise your data
- Kibana is the user interface that is used to analyse and visualise data in real time
- Beats are the simple, lightweight and quick data shipping programs
What can Elastic Stack be used for?
Elastic Stack can be used to monitor and assist in endpoint protection. Using it’s live data analytics and visualisation, administrators are able to identify and track abnormalities within their system at scale. Using Kibana, administrators are able to take those abnormalities and drill down into individual logs to identify threats and attacks as they as they occur.
How to analyse your logs?
Once you get all of your devices and systems sending log data using Beats or other output, you need to be able to view this data in a way that’s easy on the eyes. Below are a few scenarios that show how Kibana can be used to display this data easily and effectively.
Scenario 1 - Brute Force
An attacker is attempting to brute force the SSH login credentials to a server you host.
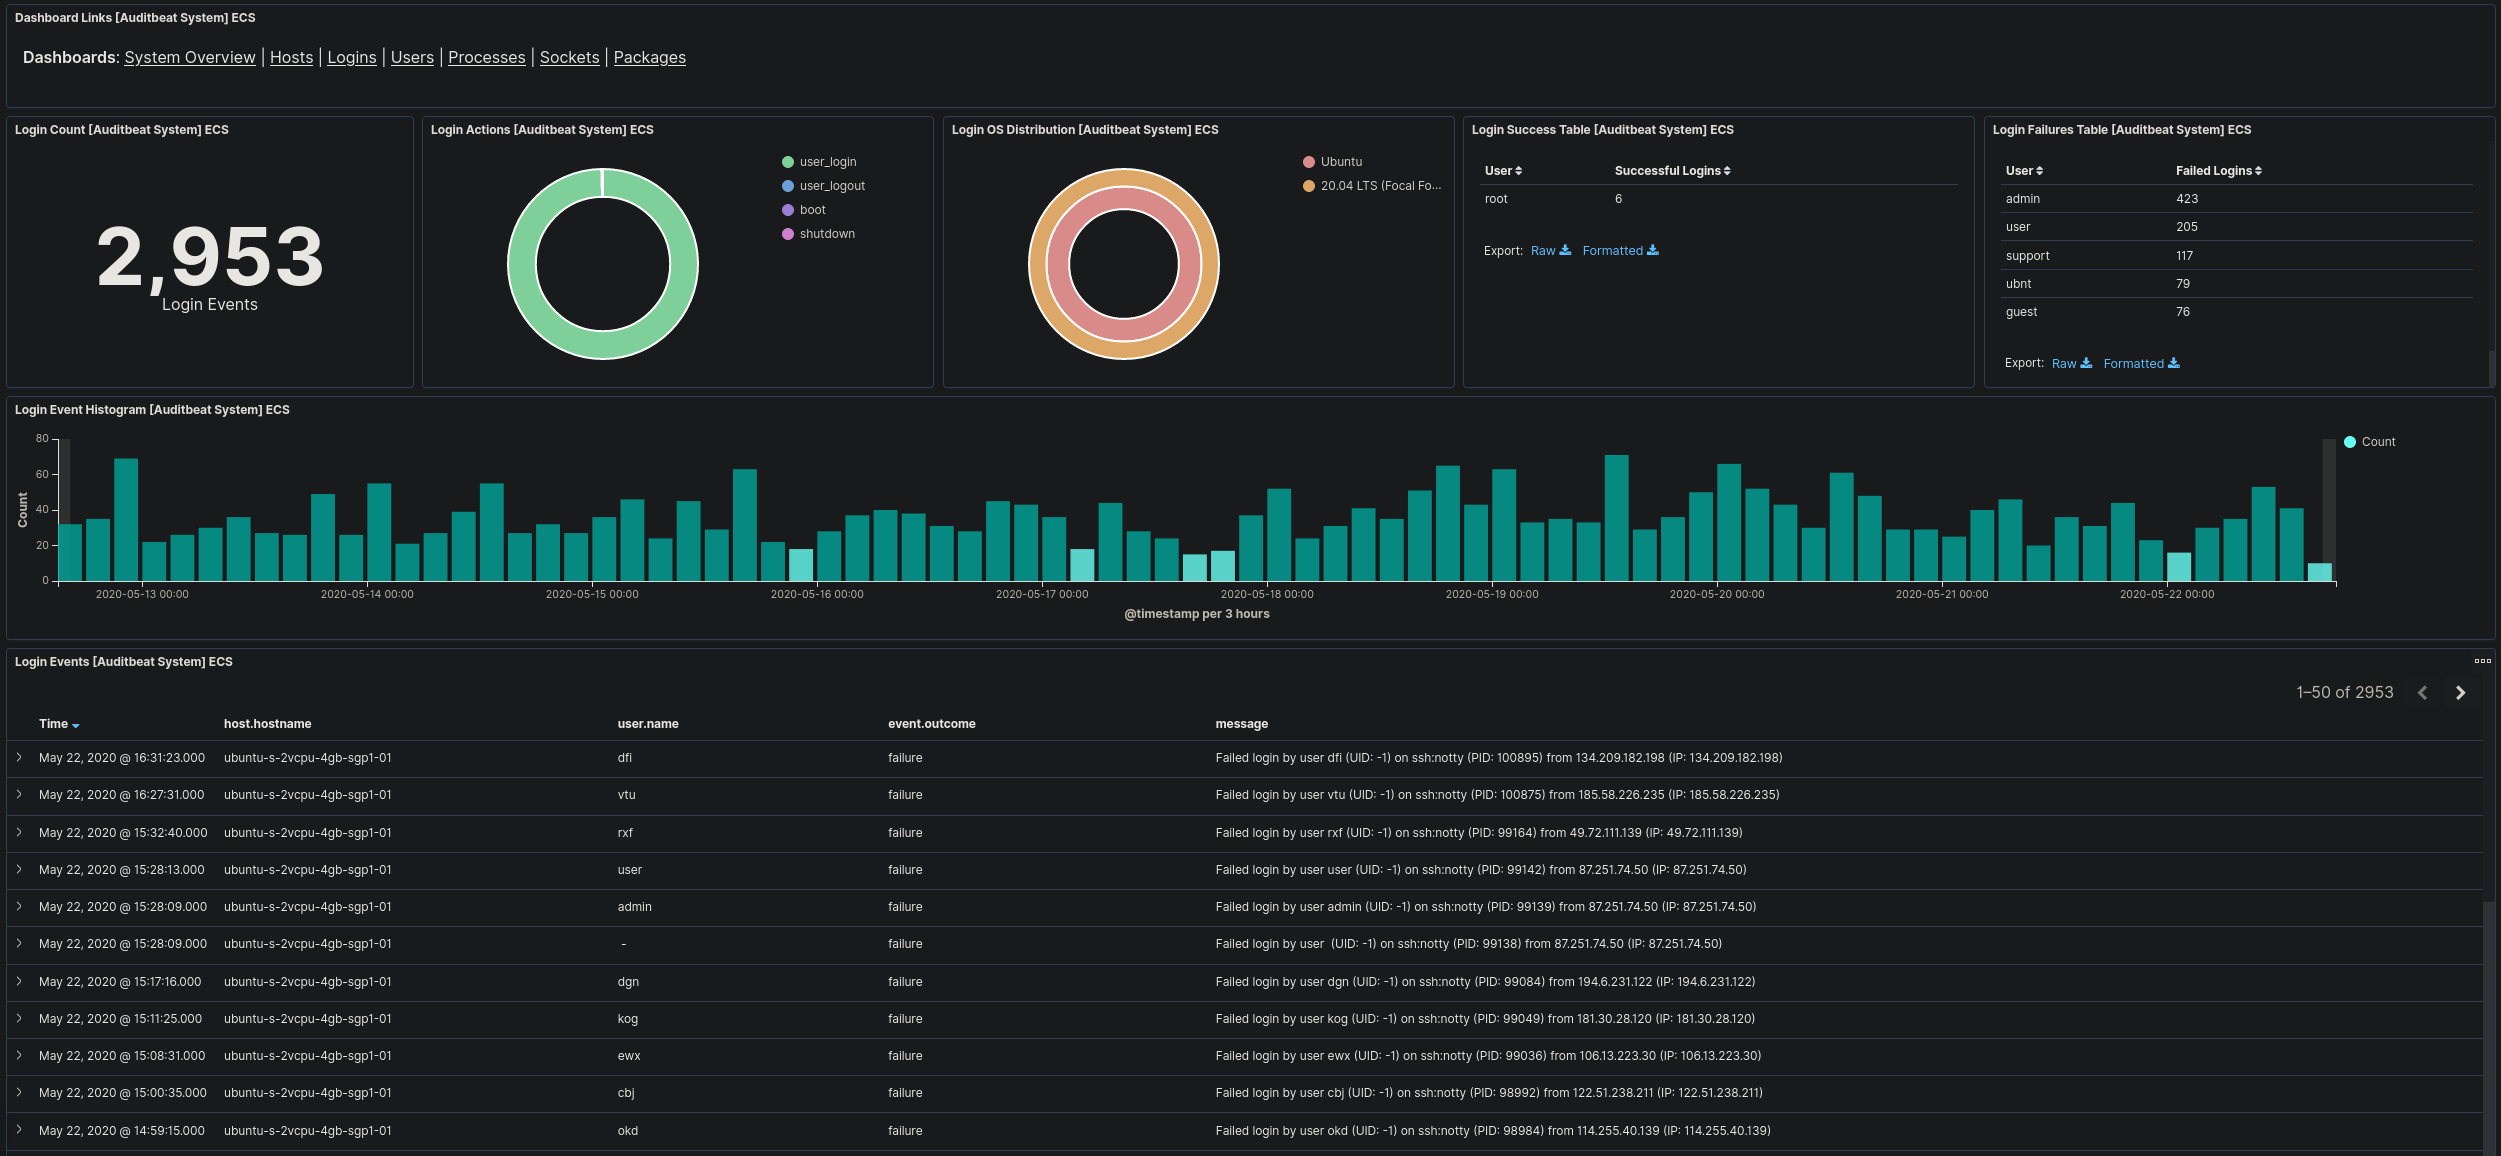
If you’re using Beats, Kibana actually will have default Dashboards and Visualisations premade that are ready to use like the following for Auditbeat logs:

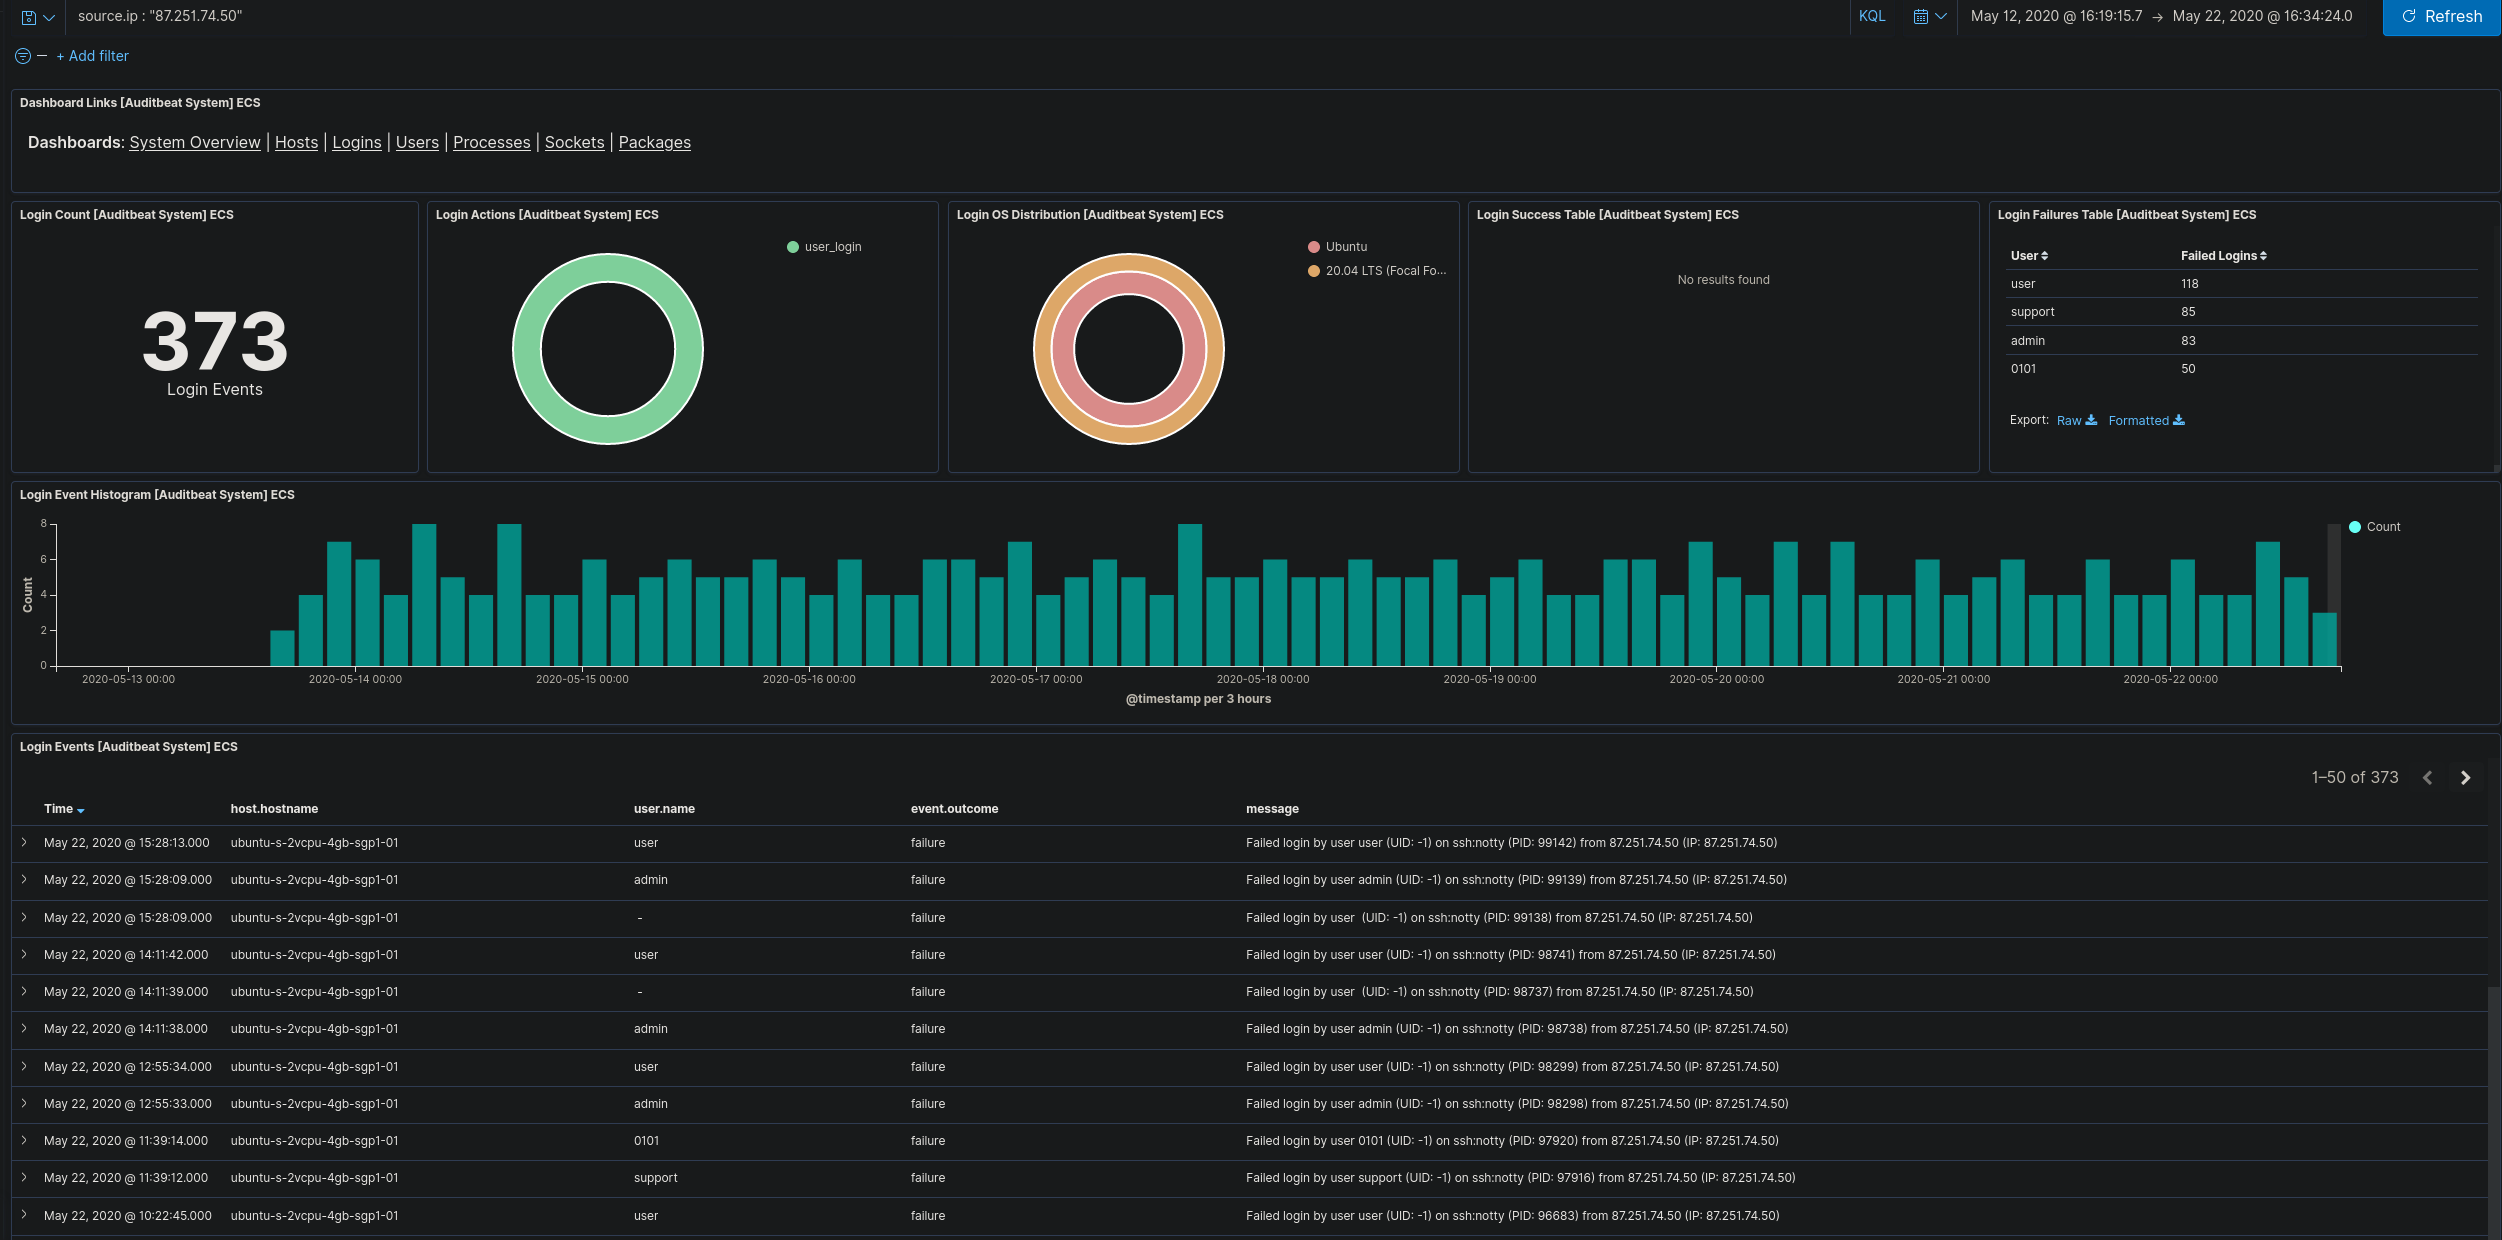
This Dashboard allows administrators to display data based on login events that have been recorded by Auditbeat. Using this we are able to filter this data further and still have full graphical display. As an example, I am able to filter this to only show login attempts from the ip “87.251.74.50”.

This IP is clearly attempting to brute force our one of our hosts. It hasn’t successfully logged in so we best block that IP address. In this example, if administrators are not viewing these logs this brute force would go unnoticed.
Scenario 2 - VPN Logins
A company who only has staff across the United States of America begins to receive connections from another country.
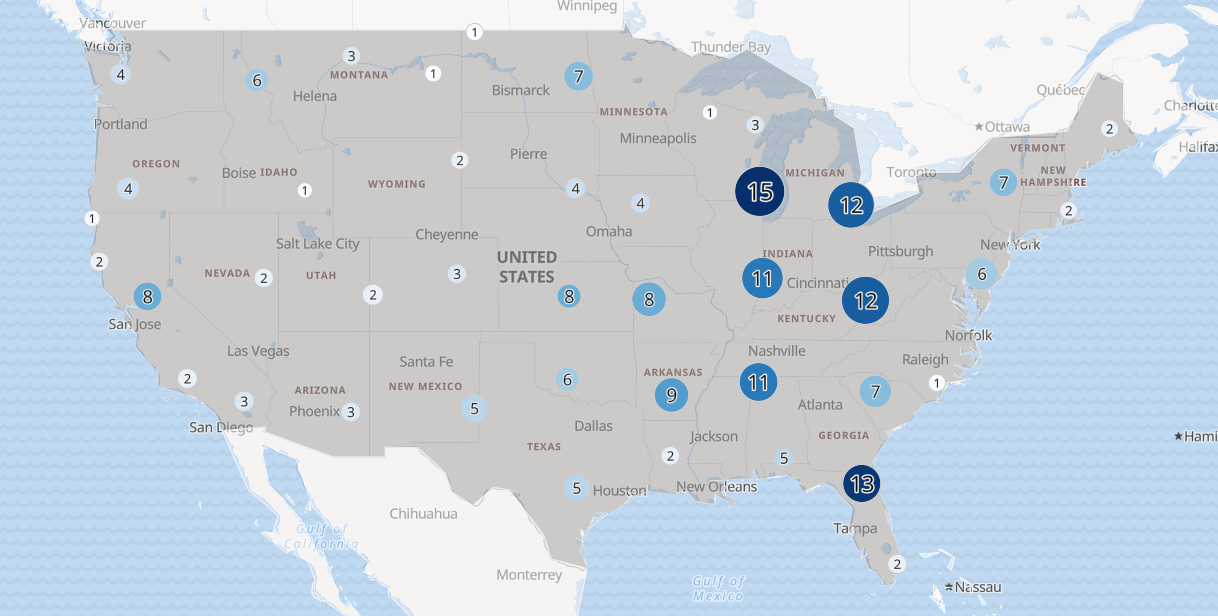
Elastic Stack allows you to find the geo location of IP addresses. Using logstash you’re able to automatically look up the co-ordinates of any incoming requests/connections of IP addresses and attach them to the log file. This allows you to get live data of your connections placed onto a world map.

If then you begin to receive successful connections from a country that you have no staff in, you’ll be able to see that displayed on the map. You can then investigate what credentials they’re logging into and lock down the compromised account.
Scenario 3 - Breached Server
Administrators are aware that a company server has been breached by an attacker but aren’t aware of what attacker did whilst on the server.
Using Discover in Kibana, we are able to filter the logs captured by Filebeat on the device to see what commands were run on the machine during the time they were connected on the machine.

This allows administrators to clearly track what the attacker did on the machine and piece together the incident. If the correct logs are collected it would be easy to track an adversary during the time they are within the system.
Additional Features
Outside of the scenarios above, there are many other features that Kibana provides that can be useful for Administrators. Below are some examples.
Recording Metrics
Administrators are able to record metric data on devices they choose which allows them to see if servers are under too much load or receiving too much traffic. The data can also be stored in case it needs to be reviewed at a later date.

Recording Uptime
Administrators are able to configure Heartbeat to provide uptime data on ports, web pages and devices

SIEM Data
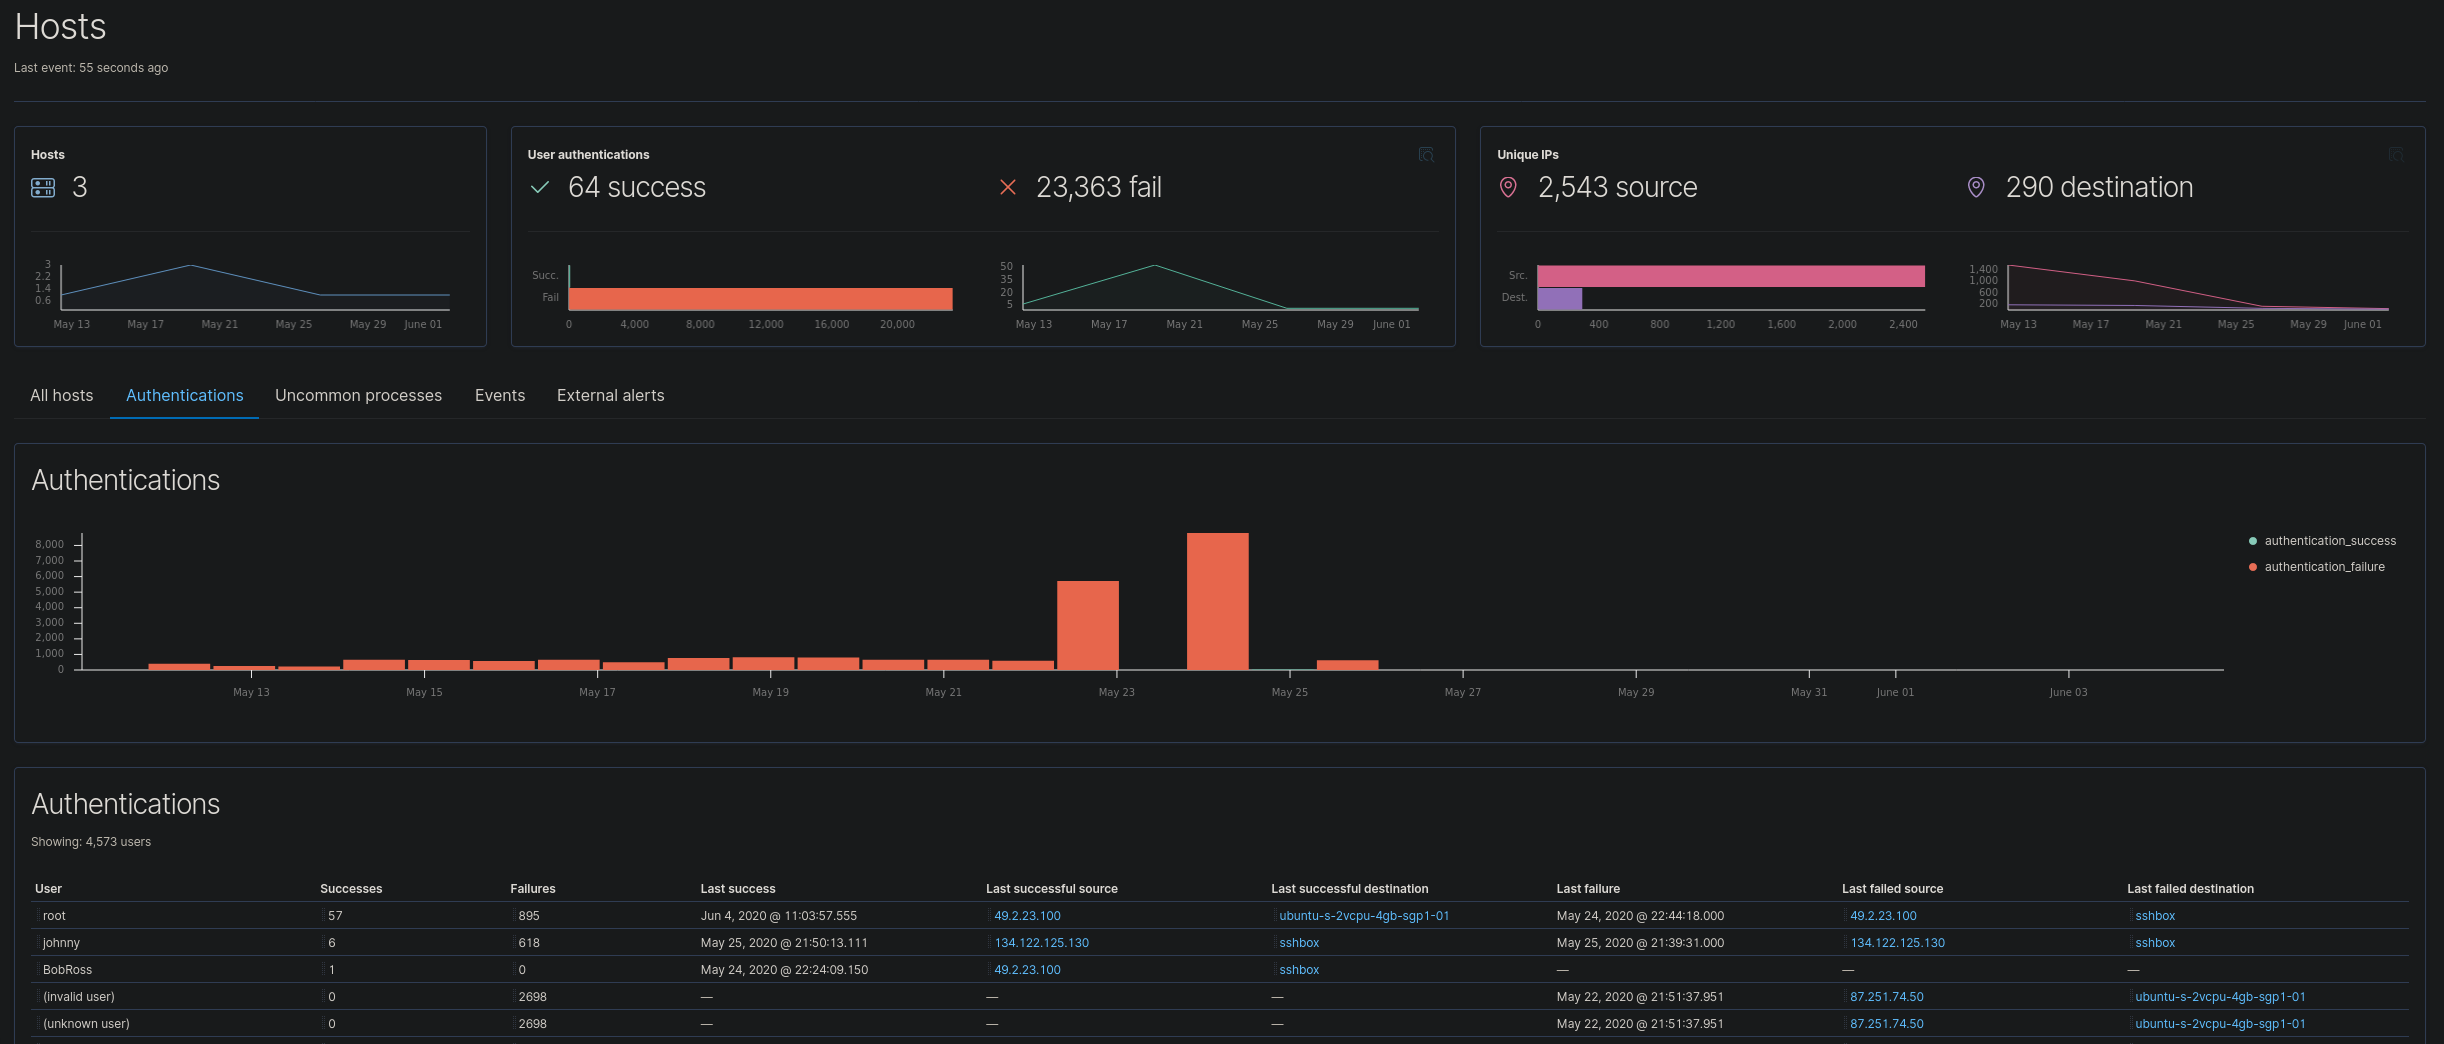
Administrators can use the SIEM Interface to get a broad overview of their network security threats

Conclusion
Elastic Stack has been constantly growing and improving over the years and can be used very effectively by admins to assist for incident response. It is a super powerful tool and once set up can make viewing logs so much easier. There is a lot to this tool already but there’s consistently more things added by Elastic and the community around it. Go and check it out.
Useful links:
Elastic Homepage: https://www.elastic.co/elastic-stack
Elastic Github: https://github.com/elastic
The different data shippers made by Elastic: https://www.elastic.co/beats/
Community made data shippers: https://www.elastic.co/guide/en/beats/libbeat/current/community-beats.html
Elastic Stack in Docker: https://github.com/deviantony/docker-elk
Hunting Elk - ELK Stack focused on Threat Hunting https://github.com/Cyb3rWard0g/HELK
