Elastic Stack CTF Scenario Walkthrough
This is a walkthrough for the Elastic Stack CTF scenario that was run for the Sectalks Ninja Night 0x08 (9th).
The CTF is available to be spun up from my repository, for more information visit HERE. Feel free to spin it up and give it a go.
Scenario:
Overnight we’ve had an attack on our network, we have two devices in the cloud and it appears both have been compromised. The attack appears to have taken place on the 25th of May between 9pm and 11:30pm. Our network is composed of one box that is front facing with an SSH port open to the web and a second server behind it running an old Elastic Stack. We believe the ssh password was bruteforced and then exploited the vulnerable elastic stack version. Both boxes have logs sent to our new Elastic Stack. Please recover the information requested in these challenges so we can piece together what happened.
- What IP did the bruteforce attack come from?
Select the SIEM Menu > Hosts > Authentications and set the time frame given in the scenario, the first few challenges can be solved within this menu.
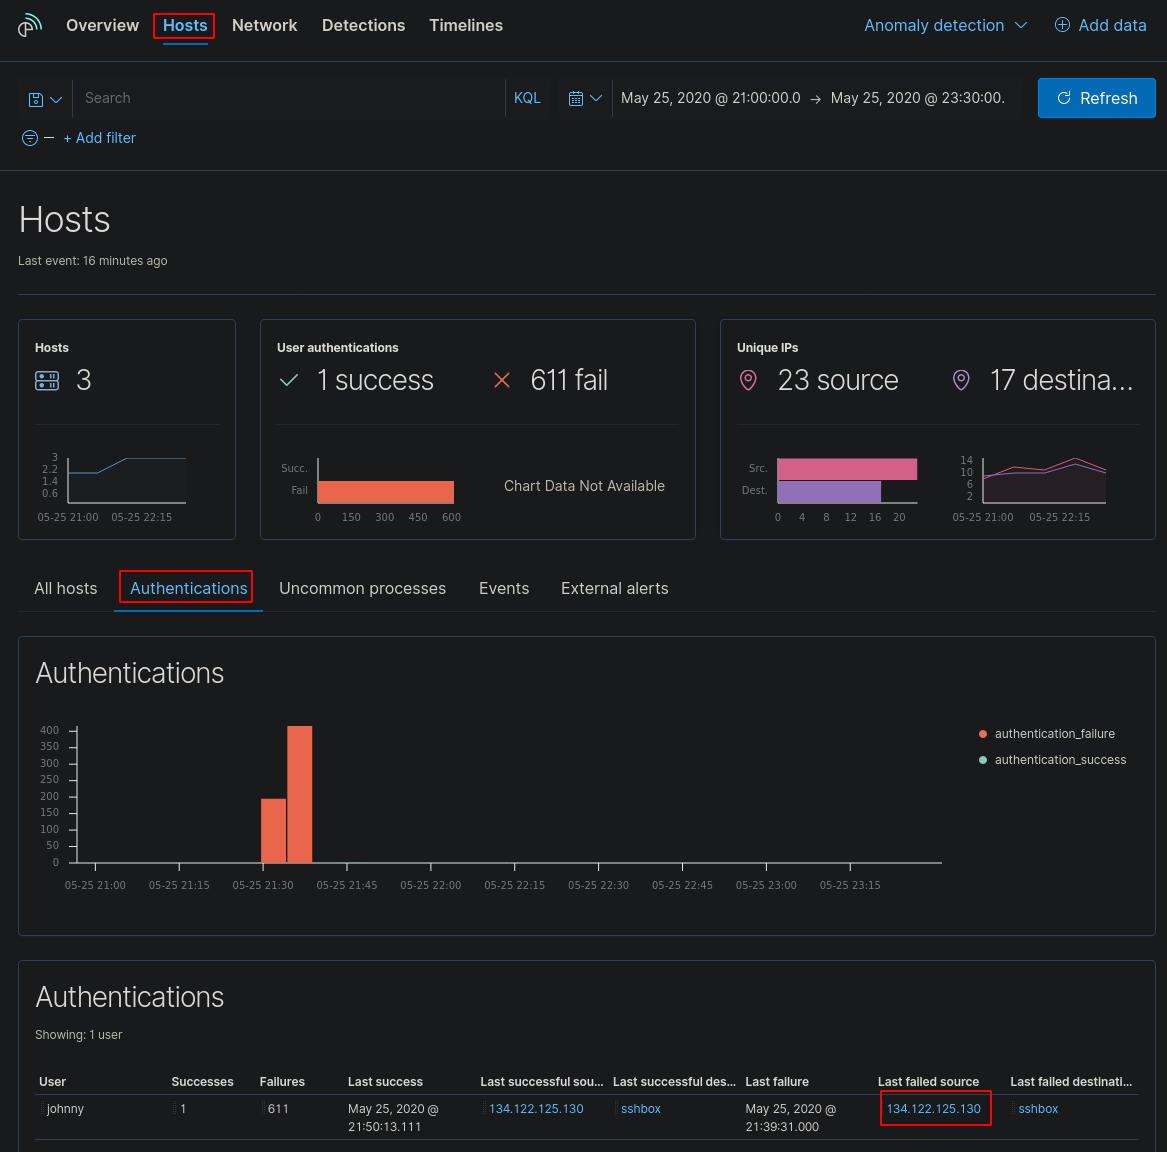
This shows us the IP address of the “Last failed source” 134.122.125.130 is the flag.
- What username did they crack?
Staying in the same menu, we can see the username that was attacked
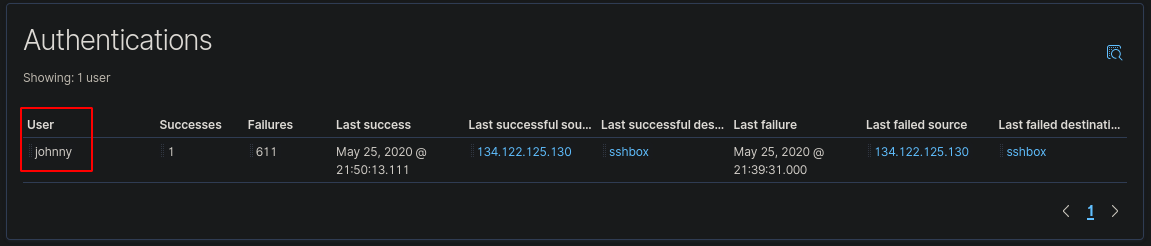
The username “johnny” was the target of the bruteforce.
- What host was attacked?
Staying in the same menu, we can see the name of the host that was attacked
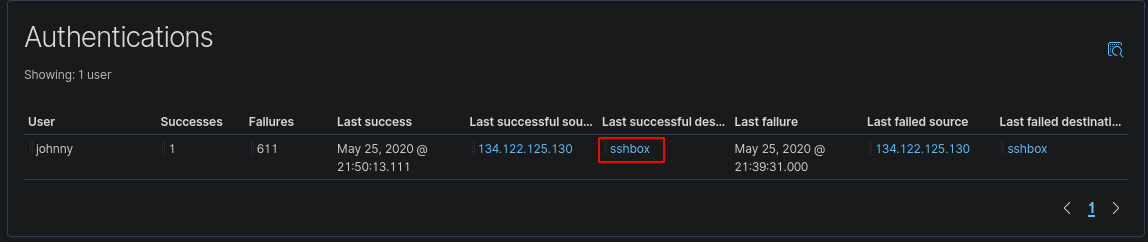
The host “sshbox” was the host that was attacked.
- How many failed attempts were made on the machine?
Staying on the same menu, we can see the amount of failed password attempts on the machine
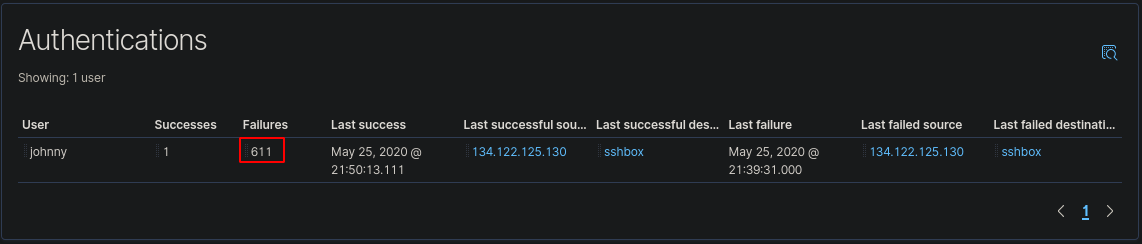
There were “611” failed attempts to authenticate to the server.
- What time was the last failed attempted login?
Although the answer is on this page, I swapped over to a dashboard to get further information on the login. Go to Dashboard > Login Dashboard ECS.

We can see the last failed log with the time of “21:39:31”.
- What time did the attacker successfully login?
Using this Dashboard we can also view the successful login time.
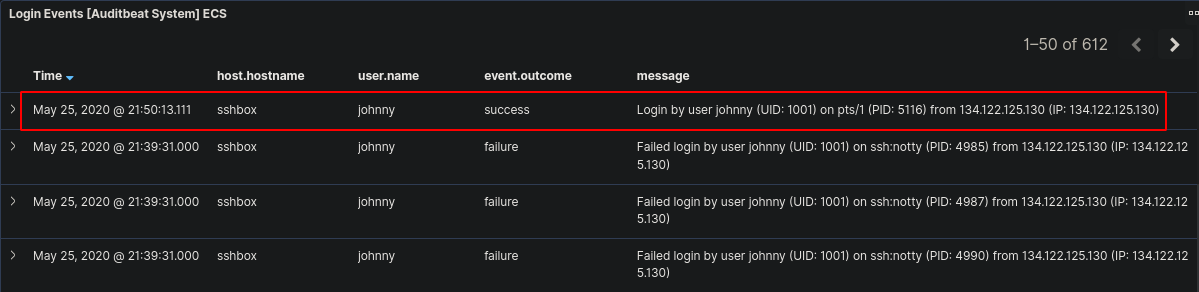
We can see the successful login time was “21:50:13”.
- What is the first command the attacker ran on the box?
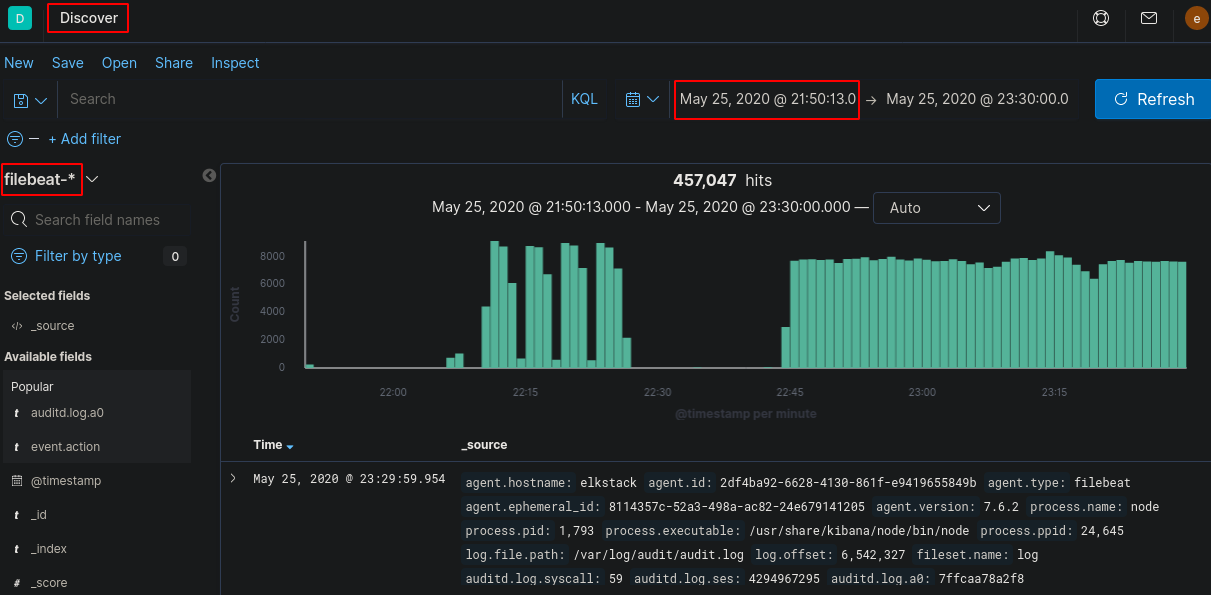
Now we will have to look deeper into the logs to view what commands were run, a good point to note is to alter the log filter start time from the original scenario time to the time of successful login (as they couldn’t run commands without being logged into the device). Go to Discover and change the Index Pattern to “filebeat-*”
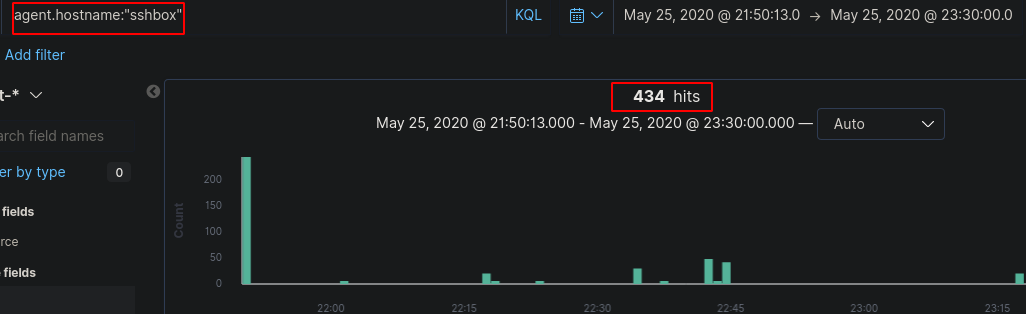
Now we need to start filtering out logs that aren’t useful. You can filter by using the search bar and/or using the selected fields.
Start off by filtering by “agent.hostname” to the box that the attacker bruteforced - immediately we drop the logs drastically from over 457,000 to 434 logs
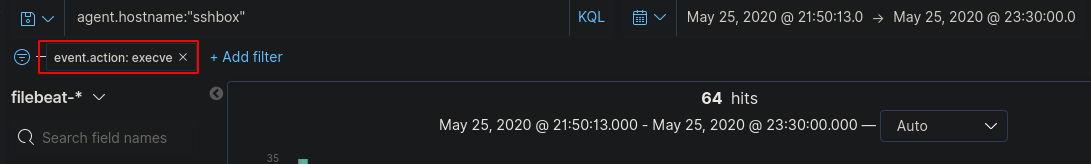
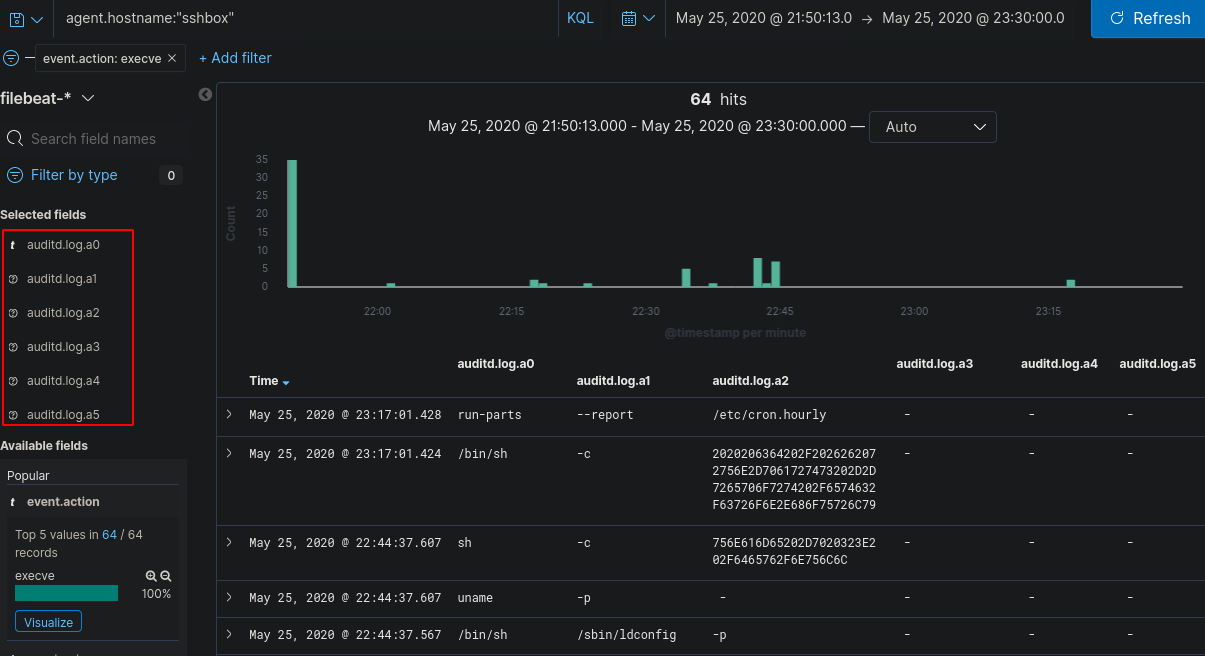
Comparing logs or by looking at the hints you can then filter the logs for the “event.action” field so it only displays docs that contain “execve” - the original logs were made using auditd which tags commands executed on the command line as “execve”
Now, we could manually go through these logs, but there’s a much easier way to filter them so they’re easier on the eyes. After viewing a few of these logs, you should notice that the “auditd.log.a0” field is the command that’s run and every consecutive number after 0 is arguments run along with it. If we select add on a few of those fields we should be able to piece together commands that were run by the attacker.
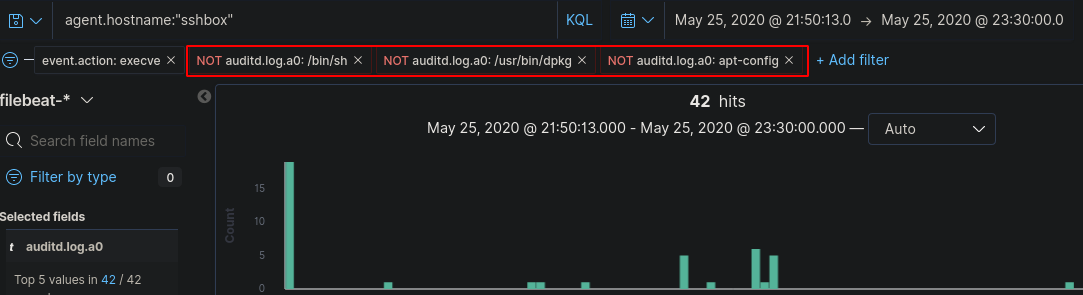
Keeping in mind, these aren’t clean logs as there are some system processes that are still appearing in this list so we can filter further by selecting “auditd.log.a0” and exclude anything matching “/bin/sh”, “/usr/bin/dpkg” and “apt-config” as these are most likely system noise.
Now we’ve got a reasonable amount of logs to look through that is easy on the eyes. Assuming the attacker didn’t type commands within milliseconds of authenticating to the machine we can see the first command was “whoami”
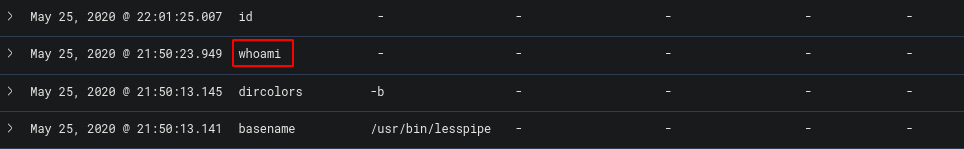
This gives us the flag.
- What tool did the attacker use to get the exploit onto the machine?
Now we have all the work done in challenge 7, the next few should be easy to spot. Viewing the commands run on the box, we can see there was some kind of connection made to github - https://github.com/LandGrey/CVE-2019-7609.git
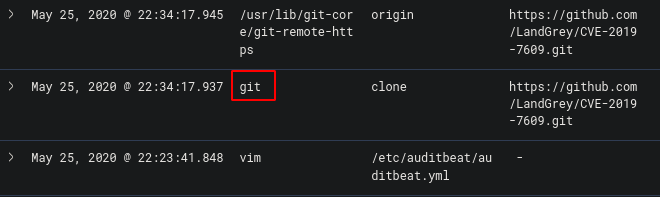
The CVE was cloned from github using “git” which was the flag.
- Shortly after getting the exploit on the machine, the attacker used vim to create a file, what is the name of that file?
Staying on the same page, we can see vim was used
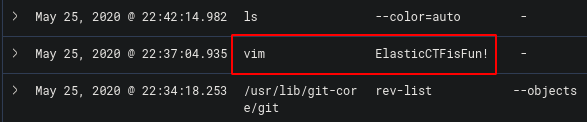
The file name was “ElasticCTFisFun!” which was the flag
- What is the filename of the exploit that was run?
Staying on the same page, we can see the exploit was run using python
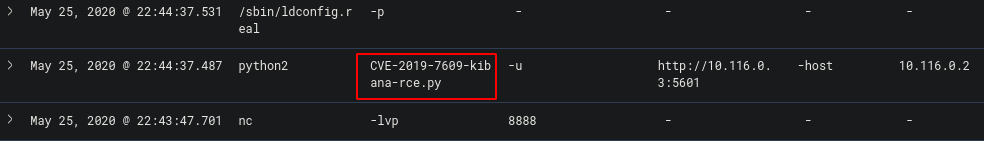
The file run was “CVE-2019-7609-kibana-rce.py” which was the flag
- What is the ID of the log that shows the exploit being run?
If we expand this log we can find the ID
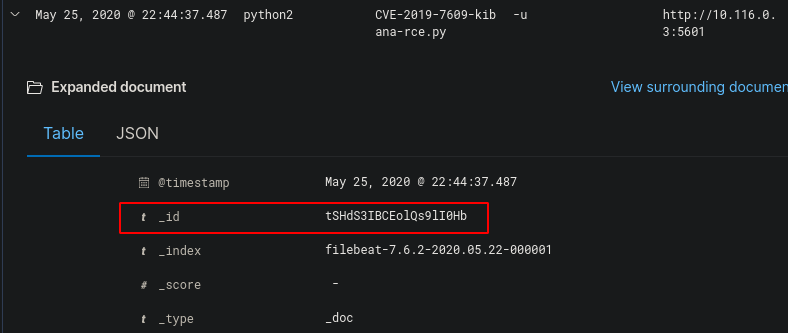
The ID was “tSHdS3IBCEolQs9lI0Hb” which was the flag
- What parameter turned the script from testing to exploiting?
Now we need to take a look at what the exploit did, looking at the github page, we can view what parameter triggers the shell.
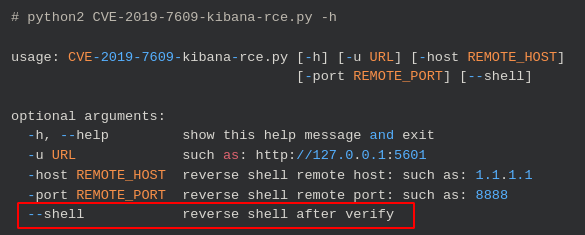
The parameter “—shell” causes the exploit to create a reverse shell which was the flag
- What IP was the shell sent to?
Looking again at the exploit on GitHub, we can see what parameter identifies the reverse shell IP

We can see what follows the -host parameter is the IP the shell is sent to which is “10.116.0.2”
- After running the exploit, they accessed the /etc/passwd file, what is the ID of the doc that shows this?
Now we need to change up the filters as we are now looking for the commands run on a different machine. Altering the “agent.hostname” to “elkstack” allows us to see the logs of the exploited computer.
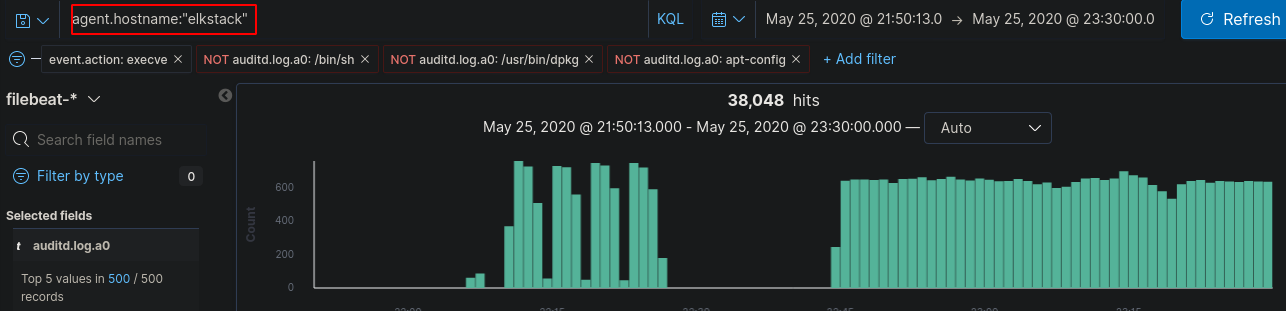
There are a lot of logs so we need to filter further. We can exclude out some of the “auditd.log.a0” fields that aren’t going to help us like “/usr/share/kibana/node/bin/node” which removes most of the logs.
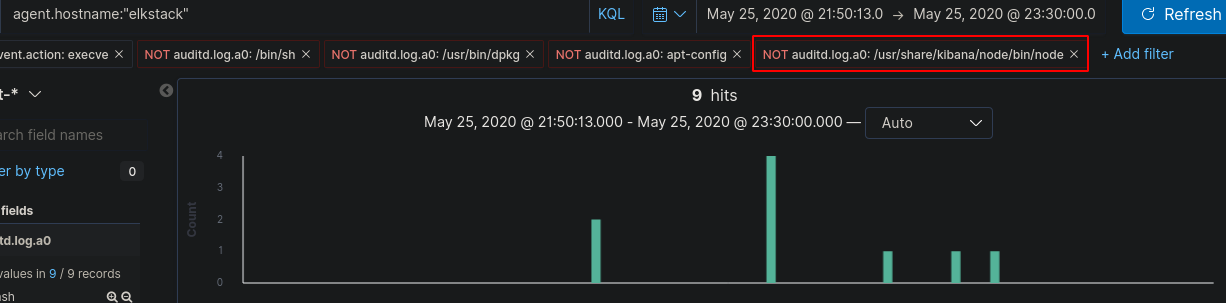
Now we can view and expand the log that mentions “/etc/passwd”
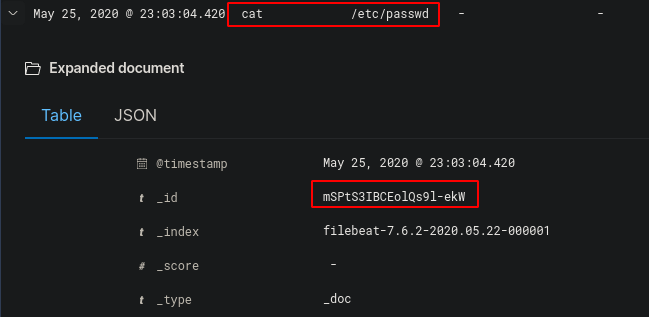
This gives us the ID “mSPtS3IBCEolQs9l-ekW” which was the flag
- We think they created a new user, what was the name of that user?
Finally, using the same filters we can see the log that has created a user.
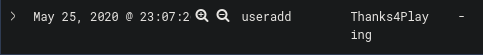
The username of the account created by the attacker was “Thanks4Playing” which was the flag.
I hope you enjoyed the Elastic CTF and I hope it gave you a chance to play around and learn the Kibana GUI.